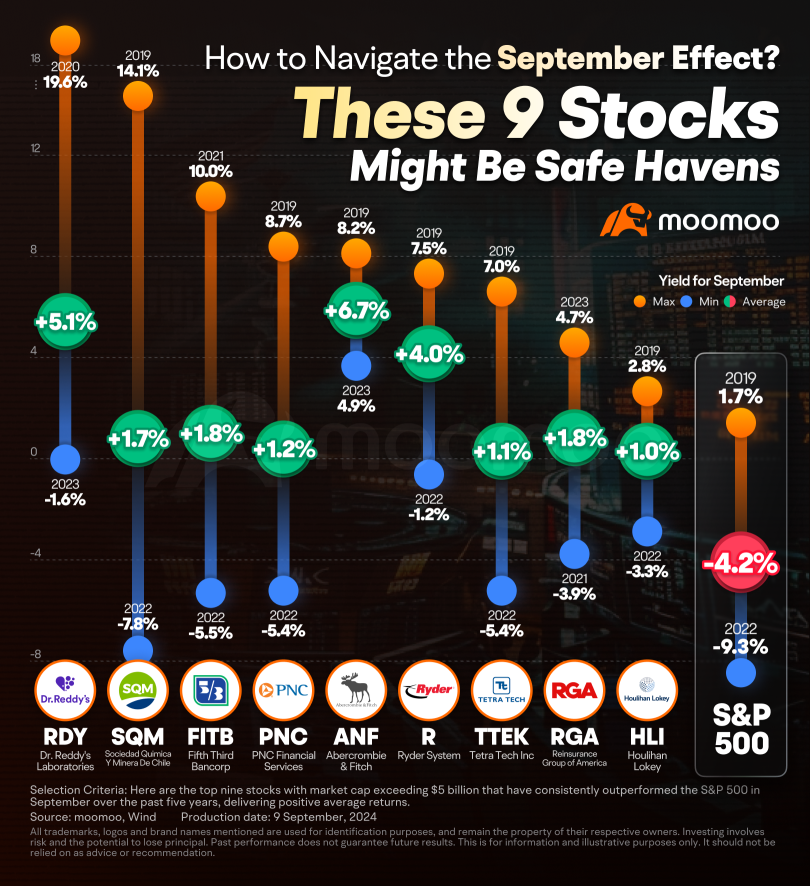
Since 1928, the$S&P 500 Index (.SPX.US)$has averaged a 1.1% decline in September. This year, with an election looming and the prospect of a rate-cutting cycle, investor sentiment is more nervous. The "September effect" appears to be resurfacing, with the S&P 500 down 3.14% month-to-date as of Monday's close, now in the second week of September. Last week, we published "Wall Street is Bracing for September Curse Again. What's New and How to Tackle It," outlini...
Despite average growth expectations, investors pay a premium for the stock, keeping its P/E ratio high. The market-matching earnings outlook doesn't impact the high P/E as expected, risking shareholders' investments and potential investors may pay an unnecessary premium.
Analysts are concerned about lower earnings per share estimates for Houlihan Lokey indicating business headwinds. Despite a steady consensus price target, EPS forecast drops could portray negative sentiments.
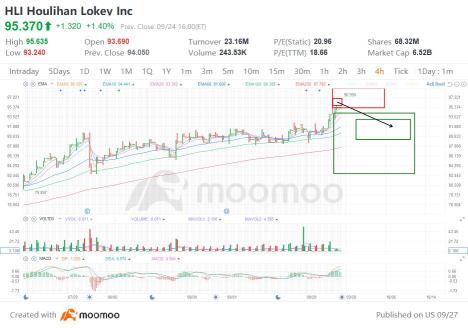
$Houlihan Lokey (HLI.US)$Based on historical movement, the peak could occur anywhere in the larger red box. The final targets are in the green boxes. The pending bottom should occur within the larger green box as has been the historical case. Half of all movement has ended in the smaller green box. In this instance, the signal indicated SELL on September 24, 2021 with a closing price of 95.39. If this instance is successful, that means the stock should decline to at least 94.85 which is the top of the larger green box. Three-quarters of all successful signals have the stock decline 2.084% from the signal closing price. This percentage is the top of the smaller green box. Half of all successful signals have the stock decline 3.597% which is the end point of the black dotted arrow. One-quarter of all successful signals have the stock decline 6.123% from the signal closing price which is the bottom of the smaller green box. The maximum decline on record would see a move to the bottom of the larger green box. These are the same concepts for the levels in the red boxes as well. The ends/vertical sides of the boxes are determined in a similar fashion. The trough of the decline can occur as soon as the next trading bar after signal close, while the max decline occurs within the limit of study at 40 trading bars after the signal. A 0.5% decline must occur over the next 40 trading bars in order to be considered a success. Three-quarters of successful movement occur after at least 12 trading bars; half occur within 31 trading bars, and one-quarter require at least 38 trading bars. The black dotted arrow represents median historical movement. Medians are a good metric, but they are just one of many I use when forecasting future movement. As always, the stock could decline the very next bar after the signal without looking back (therefore the red boxes would not come into play) or the stock may never decline (and the green boxes may never come into play).
1
Report
No comment yet
- No more -
Sign in to post a comment
Market Insights
Top Gaining Chinese Stocks Top Gaining Chinese Stocks
Stocks that are expected to benefit from a Federal Reserve rate cut. Information is provided by Futu and is a non-exhaustive list of all thematic stocks for reference purposes only.
This section presents the top 5 stocks in Fed Rate Cut Beneficiaries, ranked from highest to lowest based on real-time market data. Stocks that are expected to benefit from a Federal Reserve rate cut. Information is provided by Futu and is a non-exhaustive list of all thematic stocks for reference purposes only.
This section presents the top 5 stocks in Fed Rate Cut Beneficiaries, ranked from highest to lowest based on real-time market data.
U.S leading technology companies with strong market presence, influential in their industries, and notable for robust innovation and profitability. Information is provided by Futu and is a non-exhaustive list of all thematic stocks for reference purposes only.
This section presents the top 5 stocks in U.S Tech Companies, ranked from highest to lowest based on real-time market data. U.S leading technology companies with strong market presence, influential in their industries, and notable for robust innovation and profitability. Information is provided by Futu and is a non-exhaustive list of all thematic stocks for reference purposes only.
This section presents the top 5 stocks in U.S Tech Companies, ranked from highest to lowest based on real-time market data.
U.S. Crypto Concept Stocks U.S. Crypto Concept Stocks
Companies involved in the creation, trade, and services of digital forms of money.Displayed third-party logos, brands, or trademark images on screens or web pages are only for identification purposes and remain the property of their respective owners.Displayed third-party logos, brands, or trademark images on screens or web pages are only for identification purposes and remain the property of their respective owners. Information is provided by Futu and is a non-exhaustive list of all thematic stocks for reference purposes only.
This section presents the top 5 stocks in U.S. Crypto Concept Stocks, ranked from highest to lowest based on real-time market data. Companies involved in the creation, trade, and services of digital forms of money.Displayed third-party logos, brands, or trademark images on screens or web pages are only for identification purposes and remain the property of their respective owners.Displayed third-party logos, brands, or trademark images on screens or web pages are only for identification purposes and remain the property of their respective owners. Information is provided by Futu and is a non-exhaustive list of all thematic stocks for reference purposes only.
This section presents the top 5 stocks in U.S. Crypto Concept Stocks, ranked from highest to lowest based on real-time market data.


 !!
!!


105230749 : hi
帅哥 : Hello, good morning~
joemamaa : great work