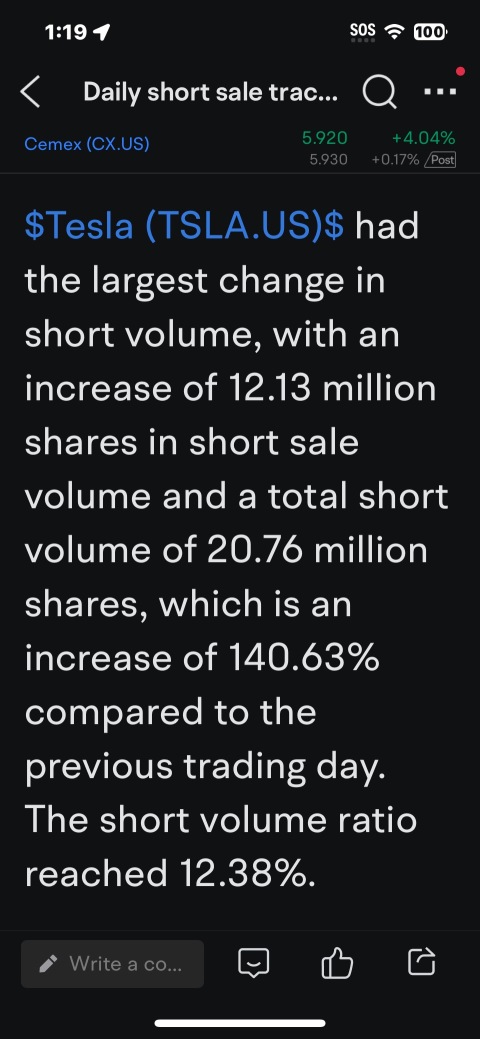
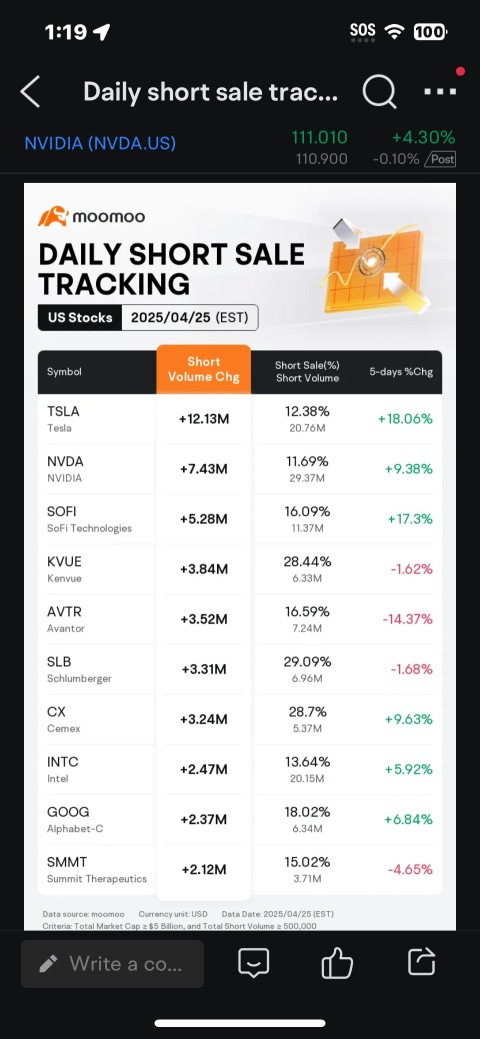
TSLATesla
284.95025.440+9.80%167.56M46.59B261.690259.510286.850259.630917.81B791.49B3.22B2.78B+18.06%+12.90%+4.33%-26.77%+10.64%+67.44%-29.44%--6.03%162.83139.6810.49%Auto Manufacturers
NVDANVIDIA
111.0104.580+4.30%251.06M27.50B106.850106.430111.920105.7302.71T2.61T24.40B23.50B+9.38%+3.20%-0.38%-10.25%-20.32%+34.39%-17.33%0.03%1.07%37.7637.765.82%Semiconductors
CLNEClean Energy Fuels
1.4800.040+2.78%1.25M1.82M1.4101.4401.4851.410331.47M261.52M223.96M176.70M+5.71%+0.68%-14.94%-54.60%-47.70%-34.22%-41.04%--0.71%LossLoss5.21%Oil & Gas Refining & Marketing
CRWDCrowdStrike
424.88010.830+2.62%3.34M1.40B414.690414.050425.735412.600105.32B98.05B247.87M230.77M+13.11%+15.27%+15.91%+7.00%+38.19%+42.57%+24.18%--1.45%LossLoss3.17%Software - Infrastructure
AVGOBroadcom
192.3104.160+2.21%21.24M4.05B186.920188.150193.370186.890904.23B888.79B4.70B4.62B+12.47%+11.61%+11.81%-6.52%+9.49%+50.38%-16.80%1.13%0.46%92.01156.353.44%Semiconductors
CMCSAComcast
33.9000.710+2.14%29.37M989.08M33.52033.19033.94033.125126.57B125.25B3.73B3.69B-0.32%+0.65%-8.46%-8.44%-18.34%-7.48%-8.09%3.72%0.80%8.358.192.46%Telecom Services
VSTVistra Energy
126.6402.410+1.94%4.32M548.36M124.380124.230128.240123.52042.93B42.70B338.96M337.14M+9.72%+15.91%+6.14%-18.27%+2.38%+76.18%-7.99%0.69%1.28%18.0918.093.80%Utilities - Independent Power Producers
GOOGLAlphabet-A
161.9602.680+1.68%56.03M9.14B165.070159.280166.100161.0401.97T1.77T12.16B10.94B+7.14%+5.98%-0.17%-17.02%-6.95%+4.32%-14.34%0.49%0.51%18.0820.143.18%Internet Content & Information
PANWPalo Alto Networks
178.9802.940+1.67%3.54M630.45M176.490176.040179.500175.330118.50B117.23B662.10M654.99M+6.73%+6.36%+2.60%-3.47%-0.43%+23.95%-1.64%--0.54%101.1249.172.37%Software - Infrastructure
RBLXRoblox
66.5800.890+1.35%4.44M294.07M65.55565.69066.90065.42044.43B38.82B667.30M583.10M+11.51%+18.64%+11.90%-4.99%+54.33%+87.39%+15.07%--0.76%LossLoss2.25%Electronic Gaming & Multimedia
AMZNAmazon
188.9902.450+1.31%36.41M6.85B187.620186.540189.940185.4902.00T1.77T10.60B9.38B+9.49%+4.29%-6.14%-20.28%-1.94%+8.82%-13.86%--0.39%34.1834.182.39%Internet Retail
CRMSalesforce
267.8503.150+1.19%5.65M1.51B264.720264.700269.030264.200257.40B248.88B961.00M929.16M+8.33%+4.99%-3.43%-24.22%-9.39%-1.36%-19.76%0.60%0.61%42.1142.111.83%Software - Application
MSFTMicrosoft
391.8504.550+1.17%18.97M7.40B387.000387.300392.160384.6002.91T2.91T7.43B7.42B+6.54%+2.75%+0.33%-11.23%-9.04%-1.05%-6.85%0.79%0.26%31.5833.211.95%Software - Infrastructure
WBDWarner Bros Discovery
8.5900.090+1.06%24.51M210.04M8.5008.5008.6558.43021.09B18.96B2.45B2.21B+5.92%+6.05%-21.98%-17.64%+10.55%+3.62%-18.73%--1.11%LossLoss2.65%Entertainment
XYZBlock
58.0900.590+1.03%5.63M325.67M57.67057.50058.27057.22035.99B32.30B619.48M556.12M+7.77%+9.79%+1.93%-35.48%-20.74%-20.20%-31.65%--1.01%12.7412.741.83%Software - Infrastructure
QCOMQualcomm
148.5601.350+0.92%5.15M761.30M146.080147.210149.200146.080164.31B163.97B1.11B1.10B+8.71%+10.54%-5.96%-13.02%-10.43%-7.20%-2.77%2.25%0.47%15.9116.562.12%Semiconductors
DBXDropbox
28.5800.220+0.78%2.44M69.72M28.33028.36028.70028.2108.23B5.69B287.91M199.01M+5.42%+5.54%+6.11%-11.79%+9.21%+19.43%-4.86%--1.23%20.4120.411.73%Software - Infrastructure
AAPLApple
209.2800.910+0.44%38.22M7.96B206.365208.370209.750206.2003.14T3.14T15.02B15.02B+6.24%+9.90%-6.51%-12.47%-8.85%+23.77%-16.34%0.47%0.26%33.2234.421.70%Consumer Electronics
NFLXNetflix
1101.5304.660+0.42%3.95M4.34B1097.0401096.8701106.7981091.000468.90B467.56B425.68M424.47M+13.21%+19.58%+12.78%+12.61%+46.14%+95.03%+23.58%--0.93%52.0655.551.44%Entertainment
MORNMorningstar
280.6300.920+0.33%123.01K34.43M276.770279.710281.010276.33012.00B7.04B42.77M25.09M+1.24%+3.67%-6.93%-13.91%-14.76%-1.83%-16.42%0.60%0.49%32.7132.711.67%Financial Data & Stock Exchanges
DISDisney
90.2800.270+0.30%7.75M696.74M90.07090.01090.34089.070163.21B163.00B1.81B1.81B+6.45%+5.93%-10.12%-20.24%-4.63%-19.22%-18.92%1.05%0.43%29.3133.191.41%Entertainment
IBKRInteractive Brokers
169.2800.230+0.14%1.01M170.57M168.520169.050170.400167.50071.53B70.43B422.58M416.03M+6.12%+3.02%+0.17%-19.77%+10.03%+45.20%-4.07%0.59%0.24%23.3224.431.72%Capital Markets
VVisa
335.170-0.540-0.16%4.45M1.49B334.760335.710336.365332.170654.78B614.63B1.95B1.83B+1.69%+3.25%-4.20%-0.04%+15.93%+22.72%+6.23%0.64%0.24%33.7934.451.25%Credit Services
AXPAmerican Express
264.810-2.510-0.94%1.94M515.22M267.000267.320268.860264.000185.52B145.98B700.59M551.27M+5.37%+7.26%-2.33%-15.72%-2.83%+12.95%-10.27%1.10%0.35%18.4918.901.82%Credit Services
TEMTempus AI
52.900-0.600-1.12%9.01M479.90M53.21053.50054.55052.2209.15B5.21B173.03M98.56M+30.78%+31.30%+1.79%+4.20%+16.24%+42.97%+56.69%--9.14%LossLoss4.36%Health Information Services
TAT&T
26.810-0.720-2.62%37.05M996.35M27.46027.53027.52026.625192.92B191.98B7.20B7.16B-1.25%+1.59%-3.92%+11.82%+24.60%+70.12%+20.50%4.14%0.52%16.4517.993.25%Telecom Services