No Data
ETHA250502C18500
- 0.00
- 0.000.00%
- 5D
- Daily
No Data
News
Ethereum Foundation Revamps Leadership With 'Twin Goals' – More Inside
Trump-backed World Liberty Financial Partners With CZ, Pakistan to Drive Crypto Adoption
The cryptocurrency market is buzzing! Institutions that accurately predicted Bitcoin's trend for 2024 are raising their flags again: it will break $0.12 million in Q2 and reach $0.2 million by the end of the year.
Standard Chartered Bank predicts that Bitcoin will reach a historical high of over $0.12 million in the second quarter.
The milestone moment for stablecoins is approaching! MasterCard will add a "stablecoin settlement" option for merchants.
MasterCard Inc. announced that, as global regulations regarding digital Assets usually pegged to fiat currencies become clearer, it will soon offer merchants the option to receive payments and settlements in stablecoins.
The moat and investment value of Ethereum.
Ethereum, backed by a strong moat and an innovative team culture, currently has zero cash flow, but its future free cash flow potential is immense. The investment value lies in the long-term ecological development and the increase in scarcity brought about by the deflationary mechanism.
Three main reasons why Ethereum is in trouble.
This article will elaborate on three more pragmatic reasons: talent crisis, fragmented user experience, and governance issues.
Comments

March 18, 2025
1️⃣ Part 1 - Complete Technical Analysis of Ethereum
📊1. Multi-Timeframe Analysis (15min, 1h, 4h, Daily)
General Trend & Market Structure
15min: Strong bullish trend with potential exhaustion.
1h: Confirmation of a strong rally with indicators in the overbought zone.
4h: Ongoing bullish recovery, with signs of momentum excess.
Daily: Returning to a bullish phase, key resistance around $1950.
---
2. Volume & Liquidi...


March 5, 2025:
🔹️Part 1: Context, Trends, and Market Structure
---
1. Multi-Timeframe Analysis and Market Structure
Multi-timeframe analysis is essential to identify underlying trends and avoid false signals. We will analyze ETH across multiple timeframes to detect key levels and the current market dynamics.
a) Monthly Chart (Long-Term)
General Trend: ETH is in a bullish recovery phase after a strong recent correction. Monthl...


March 4, 2025
1️⃣ Phase 1: Trend Analysis and Multi-Timeframe Chart Structures
---
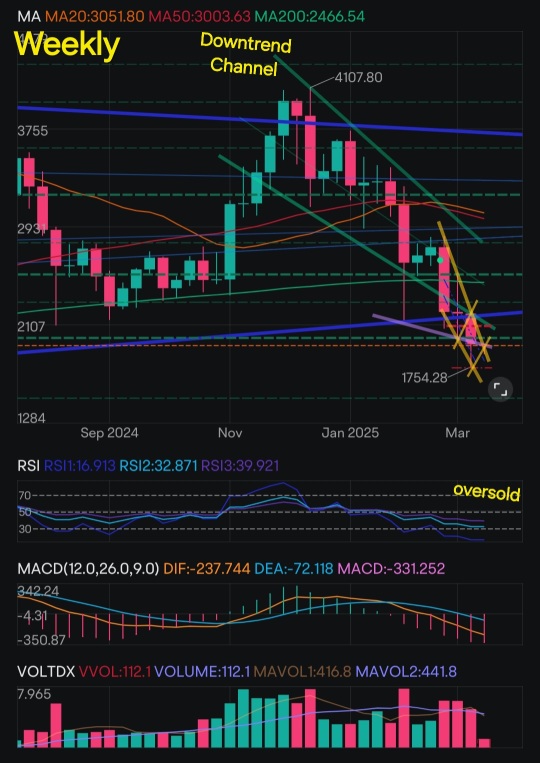
1. Weekly Chart Analysis
General Trend:
Main trend: Bearish within a long-term descending channel.
Key Support: $2002 (last tested low).
Key Resistance: $2837 (BBI) and $3152 (VWAP).
Technical Indicators:
RSI: 19.31 (extremely oversold), indicating a potential technical rebound.
MACD: -299.61 (strong negative divergence, but the bearish ...


Phase 1: Trend Analysis and Chart Structure Review
---
1. Trend Analysis and Chart Patterns
✅ Weekly Chart
Overall Trend: Bearish within a long-term descending channel.
Key Support: $2076, repeatedly tested with a potential rebound.
Key Resistance: $2947, aligned with the BBI and the 50MA.
RSI: 21.61 (extremely oversold), signaling a potential rebound.
MACD: -248.879 (very bearish), but losing momentum.
SLOWKD: K:...


 Bitcoin is slow and expensive to use (10 minutes per transaction on average, high fees).
