


RTCBaijiayun
0.32540.1399+75.42%263.23M87.59M0.22000.18550.39740.20219.55M3.84M29.36M11.80M-12.05%+54.58%+8.50%-64.24%-96.00%-95.07%-90.99%--2231.70%LossLoss105.28%Software - Application
CRWDCrowdStrike
424.88010.830+2.62%3.34M1.40B414.690414.050425.735412.600105.32B98.05B247.87M230.77M+13.11%+15.27%+15.91%+7.00%+38.19%+42.57%+24.18%--1.45%LossLoss3.17%Software - Infrastructure
AIC3.ai
22.5900.570+2.59%3.30M74.03M21.99022.02022.73021.7603.00B2.63B132.74M116.38M+16.74%+11.28%+0.27%-28.63%-12.95%+1.94%-34.39%--2.84%LossLoss4.41%Software - Infrastructure
HUBSHubSpot
615.49014.990+2.50%648.40K396.94M597.650600.500617.980597.65032.40B31.22B52.64M50.73M+14.05%+18.62%+3.72%-20.87%+9.69%-3.24%-11.67%--1.28%6838.786838.783.39%Software - Application
SHOPShopify
97.1202.000+2.10%7.82M761.31M95.79095.12098.64095.360125.75B117.32B1.29B1.21B+16.10%+14.76%-5.27%-16.70%+21.38%+37.66%-8.66%--0.65%62.6662.663.45%Software - Application
DDOGDatadog
101.5201.920+1.93%3.03M304.89M99.11099.600101.67099.11035.06B31.74B345.33M312.63M+11.34%+8.95%-3.18%-30.33%-20.79%-18.95%-28.95%--0.97%195.23195.232.57%Software - Application
ADBEAdobe
367.7206.810+1.89%3.50M1.28B361.695360.910369.310359.990156.72B156.29B426.20M425.02M+5.42%+5.05%-7.18%-16.75%-24.44%-22.33%-17.31%--0.82%24.2929.752.58%Software - Application
OKTAOkta
103.3801.840+1.81%1.53M157.53M100.735101.540103.500100.71017.95B17.03B173.60M164.78M+5.57%+1.72%-7.03%+9.98%+42.79%+11.25%+31.19%--0.93%1723.001723.002.75%Software - Infrastructure
GOOGLAlphabet-A
161.9602.680+1.68%56.03M9.14B165.070159.280166.100161.0401.97T1.77T12.14B10.94B+7.14%+5.98%-0.17%-17.02%-6.95%+4.32%-14.34%0.49%0.51%18.0820.143.18%Internet Content & Information
GDDYGoDaddy
183.4002.980+1.65%1.22M224.13M181.310180.420183.910179.54925.92B25.74B141.36M140.33M+6.76%+8.52%+0.34%-14.26%+13.49%+47.74%-7.08%--0.87%28.4328.432.42%Software - Infrastructure
TWLOTwilio
95.0701.540+1.65%2.29M217.06M93.42093.53095.80093.02514.51B13.76B152.63M144.73M+11.89%+10.89%-6.63%-34.93%+34.72%+58.42%-12.04%--1.58%LossLoss2.97%Software - Infrastructure
SAPSAP SE
277.9504.400+1.61%1.85M513.82M276.400273.550279.450274.350324.39B285.64B1.17B1.03B+7.98%+7.53%+3.65%+0.40%+17.11%+52.06%+12.89%0.86%0.18%92.3492.341.86%Software - Application
TEAMAtlassian
228.6803.600+1.60%2.55M583.61M225.000225.080232.220225.00059.91B37.16B262.00M162.49M+12.79%+15.48%+2.71%-15.72%+20.08%+15.26%-6.04%--1.57%LossLoss3.21%Software - Application
INTUIntuit
624.1209.290+1.51%1.54M956.22M616.060614.830625.205612.975174.48B170.23B279.56M272.75M+6.62%+8.08%+1.61%+5.43%+0.83%+0.28%-0.36%0.62%0.57%58.3859.841.99%Software - Application
GOOGAlphabet-C
163.8502.380+1.47%35.15M5.80B167.100161.470168.240163.0001.99T1.79T12.14B10.94B+6.84%+5.46%-0.14%-16.81%-6.77%+4.23%-13.86%0.49%0.32%18.2920.383.25%Internet Content & Information
DOCUDocuSign
82.8101.140+1.40%1.05M86.95M81.63081.67083.35081.35016.77B16.58B202.50M200.20M+9.80%+13.10%-3.32%-13.25%+20.05%+44.39%-7.93%--0.53%16.3016.302.45%Software - Application
TTDThe Trade Desk
53.9700.700+1.31%6.29M338.91M53.66053.27054.33053.05026.77B24.16B496.09M447.66M+7.38%+9.54%-5.75%-55.98%-55.76%-35.24%-54.08%--1.41%69.1969.192.40%Software - Application
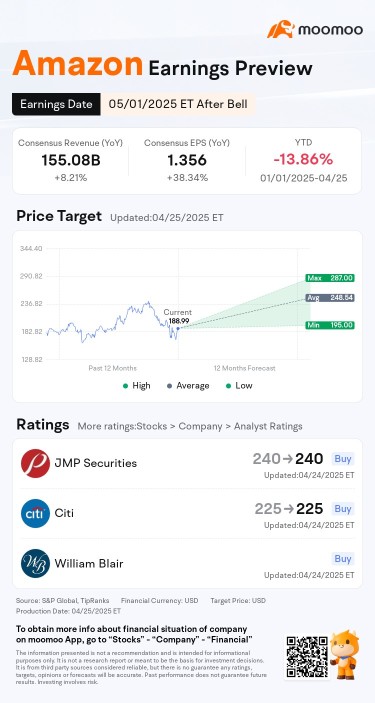
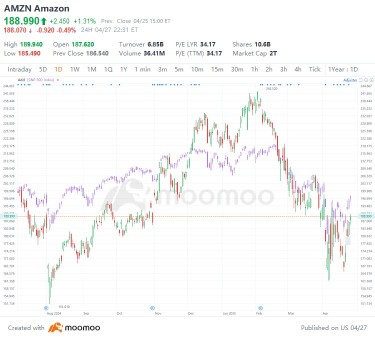
AMZNAmazon
188.9902.450+1.31%36.41M6.85B187.620186.540189.940185.4902.00T1.77T10.60B9.38B+9.49%+4.29%-6.14%-20.28%-1.94%+8.82%-13.86%--0.39%34.1834.182.39%Internet Retail
CRMSalesforce
267.8503.150+1.19%5.65M1.51B264.720264.700269.030264.200257.40B248.88B961.00M929.16M+8.33%+4.99%-3.43%-24.22%-9.39%-1.36%-19.76%0.60%0.61%42.1142.111.83%Software - Application
MSFTMicrosoft
391.8504.550+1.17%18.97M7.40B387.000387.300392.160384.6002.91T2.91T7.43B7.42B+6.54%+2.75%+0.33%-11.23%-9.04%-1.05%-6.85%0.79%0.26%31.5833.211.95%Software - Infrastructure
WDAYWorkday
239.5302.660+1.12%1.10M262.97M236.860236.870239.810235.79064.07B51.42B267.48M214.68M+8.37%+6.58%-2.05%-9.75%+0.52%-5.72%-7.17%--0.51%122.84122.841.70%Software - Application
BABAAlibaba
120.2800.990+0.83%9.31M1.11B118.580119.290120.490118.270287.22B266.63B2.39B2.22B+10.48%+15.45%-11.32%+24.36%+21.86%+63.62%+41.86%0.83%0.42%17.5928.061.86%Internet Retail
DBXDropbox
28.5800.220+0.78%2.44M69.72M28.33028.36028.70028.2108.23B5.93B287.91M207.46M+5.42%+5.54%+6.11%-11.79%+9.21%+19.43%-4.86%--1.18%20.4120.411.73%Software - Infrastructure
PAYCPaycom Software
227.6001.740+0.77%348.96K79.14M225.430225.860228.860223.79513.17B11.64B57.85M51.13M+4.93%+8.27%+0.79%+10.43%+32.58%+22.95%+11.24%0.66%0.68%25.5225.522.24%Software - Application
ZMZoom Communications
76.0300.540+0.72%1.30M98.73M75.48075.49076.32074.91523.21B19.88B305.23M261.46M+6.35%+9.22%-0.98%-12.81%+1.67%+24.56%-6.84%--0.50%23.6923.691.86%Software - Application
NOWServiceNow
945.2606.690+0.71%2.89M2.73B944.000938.570960.000929.170195.65B194.19B206.98M205.44M+22.42%+20.65%+14.20%-17.35%-0.50%+31.97%-10.83%--1.41%128.26138.203.29%Software - Application
ORCLOracle
138.4900.980+0.71%5.48M756.26M137.490137.510139.000136.755388.36B223.94B2.80B1.62B+7.67%+3.85%-4.66%-14.22%-20.18%+21.89%-16.39%1.16%0.34%32.5137.331.63%Software - Infrastructure
RNGRingCentral
25.1500.140+0.56%692.37K17.36M24.91025.01025.32024.4102.28B1.82B90.72M72.53M+10.45%+8.92%-7.81%-28.93%-29.27%-16.19%-28.16%--0.96%LossLoss3.64%Software - Application
UKUcommune International
1.1100.0000.00%16.00K17.33K1.1101.1101.1201.0501.60M1.43M1.44M1.29M-0.89%+0.91%-4.24%-3.49%-9.76%-51.74%-5.54%--1.24%0.53Loss6.29%Real Estate Services
VEEVVeeva Systems
227.540-0.170-0.07%654.87K148.33M227.460227.710228.035224.65037.02B33.94B162.70M149.16M+5.37%+8.02%-4.19%-2.05%+5.96%+14.29%+8.22%--0.44%52.6752.671.49%Health Information Services


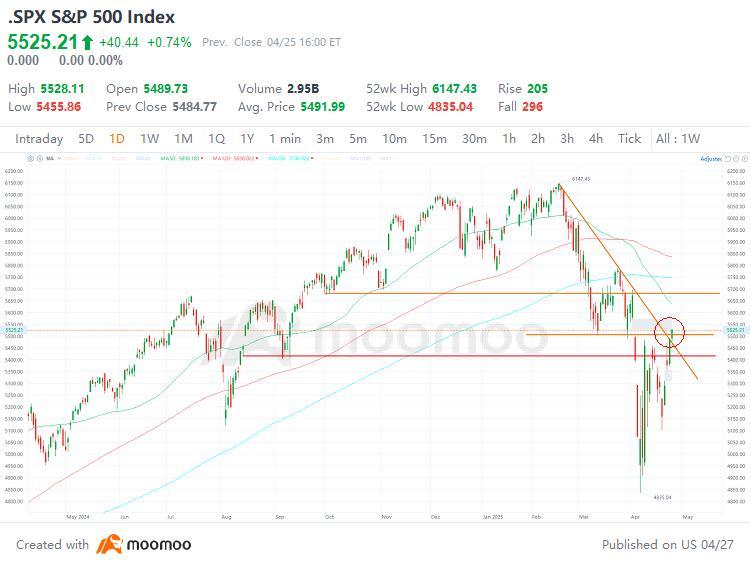


John Constantine : but i think 196-198 more likely though i also hope cross 200 .