GNKGenco Shipping & Trading
13.1100.370+2.90%1.12M14.64M12.74012.74013.25012.740563.20M550.27M42.96M41.97M+6.93%+2.50%-1.87%-7.32%-14.03%-33.54%-3.87%11.98%2.66%7.497.494.00%Marine Shipping
SFLSFL Corp
8.3100.220+2.72%901.67K7.48M8.0908.0908.3608.0901.11B897.02M133.97M107.95M+7.92%+9.34%+1.34%-18.65%-17.00%-31.31%-16.03%12.88%0.84%8.238.233.34%Marine Shipping
EHLDEuroholdings
4.8700.120+2.53%12.24K59.52K4.8704.7504.8704.85013.73M12.89M2.82M2.65M+6.10%+0.83%+1.88%-78.71%-78.71%-78.71%-78.71%--0.46%1.571.780.42%Marine Shipping
MATXMatson
108.9702.350+2.20%620.54K67.75M107.210106.620110.430107.0203.58B3.50B32.83M32.10M+13.19%+6.27%-14.98%-22.99%-28.69%+0.06%-18.98%1.21%1.93%7.827.823.20%Marine Shipping
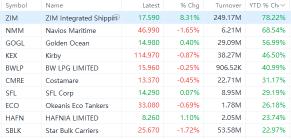
ZIMZIM Integrated Shipping
14.7200.250+1.73%2.80M41.11M14.37014.47014.84014.3351.77B1.75B120.46M119.12M+13.06%+3.52%+0.89%+0.59%-11.69%+74.41%-16.60%26.97%2.35%0.830.833.49%Marine Shipping
EDRYEuroDry
8.7580.142+1.65%1.63K14.31K8.7808.6168.7808.75824.76M11.37M2.83M1.30M-2.68%-4.16%-20.23%-23.77%-48.33%-56.64%-21.80%--0.13%LossLoss0.25%Marine Shipping
GOGLGolden Ocean
7.6700.120+1.59%1.98M15.20M7.5707.5507.7607.5601.53B764.63M199.38M99.69M+8.95%+5.21%-3.88%-15.54%-25.04%-38.90%-12.81%15.65%1.98%6.856.852.65%Marine Shipping
PSHGPerformance Shipping
1.3500.020+1.50%88.68K118.46K1.3401.3301.3701.31016.78M13.97M12.43M10.34M-0.74%-2.88%-15.63%-20.12%-32.16%-34.15%-27.42%--0.86%1.221.224.51%Marine Shipping
ECOOkeanis Eco Tankers
23.4700.330+1.43%74.62K1.75M23.32023.14023.67023.250755.60M315.34M32.19M13.44M+9.78%+13.71%+6.20%-1.33%-7.07%-17.33%+12.27%14.10%0.56%6.946.941.82%Marine Shipping
ASCArdmore Shipping
9.6700.120+1.26%335.98K3.24M9.5109.5509.7259.500391.67M346.44M40.50M35.83M+7.33%+8.41%-1.23%-17.82%-29.41%-39.73%-19.72%11.17%0.94%3.163.162.36%Marine Shipping
HMRHeidmar Maritime Holdings
2.7100.030+1.12%88.49K238.33K2.7102.6802.7402.650154.75M83.64M57.10M30.86M-7.82%-2.87%-12.30%-24.66%-96.37%-96.24%-83.98%--0.29%LossLoss3.36%Marine Shipping
ICONIcon Energy
2.0700.020+0.98%66.50K139.32K2.1002.0502.1502.0404.52M4.51M2.19M2.18M0.00%+6.70%+8.26%-86.85%-97.46%-98.61%-97.68%318.84%3.05%LossLoss5.37%Marine Shipping
HSHPHimalaya Shipping
5.3000.050+0.95%95.20K505.87K5.3005.2505.3705.300246.72M156.67M46.55M29.56M+16.74%+12.29%-2.47%+10.86%-18.55%-30.81%+10.29%9.06%0.32%11.0411.041.33%Marine Shipping
HAFNHafnia
4.6000.040+0.88%1.72M7.98M4.5804.5604.6694.5802.29B1.09B497.99M236.82M+6.73%+9.79%+10.58%-12.46%-14.23%-28.71%-16.86%29.80%0.73%3.073.071.96%Marine Shipping
ESEAEuroseas
31.3100.260+0.84%9.77K307.15K31.44031.05031.75030.875220.66M89.18M7.05M2.85M+10.95%+6.61%+2.15%+26.67%-3.20%+20.58%+8.51%7.67%0.34%1.931.932.82%Marine Shipping
CMRECostamare
9.2100.070+0.77%563.92K5.19M9.0909.1409.2709.0901.10B432.01M119.96M46.91M+8.74%+3.33%-5.17%-19.98%-31.40%-19.65%-26.70%4.99%1.20%3.773.771.97%Marine Shipping
DACDanaos
80.4700.510+0.64%61.63K4.96M79.80079.96080.81079.8001.50B728.32M18.67M9.05M+5.81%+4.11%+3.13%+2.59%+0.18%+8.43%+1.52%4.04%0.68%3.093.091.26%Marine Shipping
SHIPSeanergy Maritime
5.8200.030+0.52%56.34K328.72K5.7405.7905.9015.732121.65M83.94M20.90M14.42M+11.07%+8.18%-9.06%-14.79%-34.23%-33.13%-15.03%9.62%0.39%2.762.762.91%Marine Shipping
GSLGlobal Ship Lease
21.4100.110+0.52%250.79K5.36M21.16021.30021.49021.160765.11M700.73M35.74M32.73M+6.94%+5.31%-6.30%+1.22%-7.39%-0.01%+0.06%7.71%0.77%2.212.211.55%Marine Shipping
UFGUni-Fuels
4.5600.020+0.44%31.46K142.62K4.5604.5404.5604.490147.81M9.58M32.42M2.10M-0.55%-19.15%-17.09%-2.98%+14.00%+14.00%+14.00%--1.50%912.00912.001.54%Marine Shipping
PANLPangaea Logistics Solutions
4.0800.015+0.37%211.58K860.95K4.0604.0654.1154.030267.76M134.08M65.63M32.86M+0.74%-5.34%-14.29%-20.76%-31.48%-39.65%-22.38%9.80%0.64%6.486.482.09%Marine Shipping
SBLKStar Bulk Carriers
14.6900.050+0.34%676.56K9.93M14.55014.64014.76014.5501.72B1.37B117.13M93.55M+8.33%+3.38%-5.59%-3.86%-19.52%-33.85%-1.16%17.02%0.72%5.255.251.43%Marine Shipping
NCTIntercont
4.5000.010+0.22%35.60K161.87K4.4604.4905.1204.350120.04M7.54M26.68M1.68M-25.37%-21.05%-21.33%-35.71%-35.71%-35.71%-35.71%--2.13%38.1438.1417.15%Marine Shipping
KEXKirby
95.9700.190+0.20%454.99K43.59M95.08095.78096.45094.9905.46B5.41B56.90M56.41M+1.27%-0.08%-4.99%-12.08%-16.02%-12.75%-9.29%--0.81%19.5519.551.52%Marine Shipping
USEAUnited Maritime
1.1900.0000.00%14.49K17.24K1.1901.1901.2001.18010.95M8.59M9.20M7.22M+2.59%+2.59%-12.50%-34.53%-44.14%-45.89%-30.75%25.21%0.20%LossLoss1.68%Marine Shipping
GLBSGlobus Maritime
1.1300.0000.00%7.36K8.24K1.1101.1301.1301.11023.26M15.74M20.58M13.93M-0.88%-5.04%-6.60%-14.39%-32.74%-40.53%-3.42%--0.05%56.5056.501.77%Marine Shipping
DSXDiana Shipping
1.4600.0000.00%152.65K224.15K1.4801.4601.5001.450169.02M77.64M115.77M53.18M0.00%+1.39%-6.41%-19.32%-33.20%-47.63%-25.08%16.10%0.29%29.2029.203.43%Marine Shipping
SBSafe Bulkers
3.3800.0000.00%367.55K1.24M3.3503.3803.4203.350355.81M190.58M105.27M56.39M+5.30%-2.31%-8.40%-3.50%-17.17%-31.16%-4.04%5.92%0.65%4.074.072.07%Marine Shipping
GASSStealthGas
5.4000.0000.00%45.86K248.70K5.4105.4005.4705.360199.68M91.75M36.98M16.99M+6.30%+6.93%-4.42%-4.26%-4.76%-12.90%-4.42%--0.27%2.842.842.04%Marine Shipping
NMMNavios Maritime
33.910-0.020-0.06%98.39K3.34M33.78033.93034.34033.640999.92M508.87M29.49M15.01M+6.13%+1.92%-13.54%-19.49%-36.40%-22.95%-21.58%0.59%0.66%2.832.832.06%Marine Shipping