RTCBaijiayun
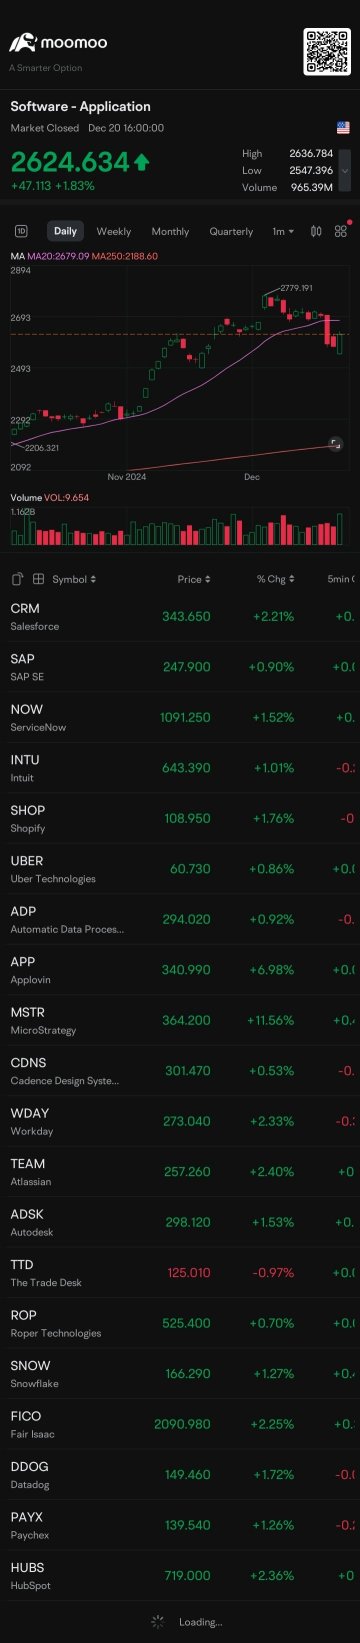
0.32540.1399+75.42%263.23M87.59M0.22000.18550.39740.20219.55M3.84M29.36M11.80M-12.05%+54.58%+8.50%-64.24%-96.00%-95.07%-90.99%--2231.70%LossLoss105.28%Software - Application
ULYUrgent.ly
7.6402.970+63.60%223.78K1.33M4.7404.6707.7304.6209.51M8.40M1.24M1.10M+66.45%+55.28%+59.83%+29.93%+12.68%-61.65%+24.84%--20.36%LossLoss66.60%Software - Application
CREXCreative Realities
1.9400.380+24.36%153.20K275.05K1.5801.5601.9501.57020.27M14.34M10.45M7.39M+42.65%+33.79%-0.51%-22.71%-53.14%-44.41%-20.82%--2.07%LossLoss24.35%Software - Application
EPWKEPWK Holdings
12.7101.810+16.61%739.22K9.46M10.53010.90014.20010.530283.69M71.97M22.32M5.66M+146.32%+158.86%+159.92%+210.00%+210.00%+210.00%+210.00%--13.06%LossLoss33.67%Software - Application
RYDERyde Group
0.26990.0354+15.10%248.44K64.35K0.22770.23450.27970.22777.91M4.83M29.29M17.90M+24.49%+18.43%-9.09%-30.62%-54.18%-92.54%-41.33%--1.39%LossLoss22.18%Software - Application
GRABWGRAB HLDGS LTD C/WTS (TO PUR COM)
0.41100.0410+11.08%40.55K15.13K0.37000.37000.41100.35000000+23.42%+37.00%-17.64%-8.75%+39.27%+106.53%+0.86%--0.00%0.000.0016.49%Software - Application
SMSISmith Micro Software
1.1700.110+10.38%228.26K257.08K1.0801.0601.1701.06020.80M15.35M17.77M13.12M+27.95%+54.11%+46.82%-9.30%+41.13%-47.30%-10.69%--1.74%LossLoss10.38%Software - Application
SWVLSwvl Holdings
3.3400.290+9.51%14.66K46.63K3.0903.0503.4302.96033.06M18.01M9.90M5.39M+14.78%+17.19%-20.29%-32.39%+0.30%-72.53%-47.67%--0.27%LossLoss15.41%Software - Application
VERBVerb Technology
4.8200.407+9.23%31.88K149.19K4.6174.4134.8704.4615.37M4.19M1.11M869.48K+14.76%+15.04%-3.41%-20.34%-62.31%-84.96%-26.30%--3.67%LossLoss9.26%Software - Application
ALTSALT5 Sigma
6.3200.530+9.15%223.87K1.37M5.6705.7906.5005.650101.62M99.83M16.08M15.80M+22.72%+64.58%+42.66%+13.46%+156.91%+34.18%+35.91%--1.42%LossLoss14.68%Software - Application
CRNCCerence
9.7100.780+8.73%1.10M10.33M8.9008.9309.7608.840419.46M412.52M43.20M42.48M+27.93%+34.86%+14.10%-26.55%+211.22%+3.41%+23.69%--2.58%LossLoss10.30%Software - Application
SAGTSagtec Global
3.7000.280+8.19%38.49K135.51K3.1403.4203.7503.14046.44M6.48M12.55M1.75M+60.87%+65.92%+17.83%-7.50%-7.50%-7.50%-7.50%--2.20%28.0345.1217.84%Software - Application
SGNSigning Day Sports
0.56010.0405+7.79%241.19K133.25K0.51690.51960.58670.49501.11M905.69K1.99M1.62M+6.12%-37.07%-27.26%-87.09%-94.46%-96.26%-78.70%--14.92%LossLoss17.65%Software - Application
RMNIRimini Street
3.5000.250+7.69%328.14K1.13M3.2003.2503.5403.175319.54M146.51M91.30M41.86M+12.18%+4.79%-2.78%+16.86%+120.13%+25.00%+31.09%--0.78%LossLoss11.23%Software - Application
PRCHPorch Group
5.9100.420+7.65%2.02M11.66M5.5705.4905.9855.300604.34M481.56M102.26M81.48M+11.72%+9.75%-19.70%+42.41%+146.25%+84.11%+20.12%--2.48%LossLoss12.48%Software - Application
VTSIVirTra
4.0300.280+7.47%75.40K295.45K3.7303.7504.0703.71045.38M43.84M11.26M10.88M+6.90%-3.59%-21.97%-38.19%-36.83%-66.47%-40.30%--0.69%33.5833.589.60%Software - Application
NTCLNetClass Technology
12.9900.880+7.27%23.06K287.42K12.20012.11013.26511.625231.61M65.27M17.83M5.03M+15.57%+29.25%+66.97%+44.98%+147.43%+147.43%+122.05%--0.46%LossLoss13.54%Software - Application
ZENVZenvia
1.5200.100+7.04%9.48K14.01K1.5001.4201.5201.40078.84M16.91M51.87M11.12M+18.75%+10.95%-16.02%-42.21%+13.43%-30.91%-34.76%--0.09%LossLoss8.45%Software - Application
IDAIT Stamp
2.1300.140+7.04%58.53K121.74K1.9901.9902.2001.9655.30M4.27M2.49M2.01M+38.44%+23.12%+5.45%-45.38%-36.29%-81.32%-83.92%--2.92%LossLoss11.81%Software - Application
FRGTFreight Technologies
1.01840.0628+6.57%62.20K61.77K1.01000.95561.03000.96002.31M756.54K2.27M742.88K+16.32%+8.46%-8.25%-26.73%-41.47%-95.54%-46.12%--8.37%LossLoss7.33%Software - Application
YAASYouxin Technology
2.3700.140+6.28%26.25K61.26K2.1902.2302.4202.15079.51M9.89M33.55M4.18M+35.43%+16.75%-1.82%-37.63%-47.33%-47.33%-41.14%--0.63%LossLoss12.11%Software - Application
NXPLNextPlat
0.57800.0299+5.46%908.20K561.83K0.55000.54810.72990.513715.01M8.33M25.96M14.41M+17.00%-14.00%-38.18%-45.98%-47.93%-52.23%-46.48%--6.30%LossLoss39.45%Software - Application
MSTRStrategy
368.71018.370+5.24%19.34M7.08B354.000350.340373.230353.12098.14B90.70B266.18M245.99M+16.24%+35.39%+13.59%+8.05%+49.09%+197.25%+27.31%--7.86%LossLoss5.74%Software - Application
FTFTFuture FinTech
1.5300.070+4.79%69.77K105.01K1.4601.4601.5791.3904.67M4.21M3.05M2.75M+11.68%+17.69%-18.44%-42.09%-53.07%-81.79%-50.63%--2.53%LossLoss12.90%Software - Application
WETOWebus International
4.3000.195+4.74%27.06K112.97K4.1004.1064.3004.09094.60M16.13M22.00M3.75M+10.26%+14.67%+12.86%+7.50%+7.50%+7.50%+7.50%--0.72%LossLoss5.12%Software - Application
DUOTDuos Technologies
6.6900.290+4.53%100.57K661.42K6.4006.4006.8006.38077.96M55.67M11.65M8.32M+16.35%+49.66%+10.58%+13.39%+55.58%+111.71%+11.87%--1.21%LossLoss6.56%Software - Application
IMMRImmersion
7.4100.290+4.07%310.06K2.27M7.1457.1207.4207.105240.06M218.56M32.40M29.50M+4.81%+6.53%-7.02%-11.44%-11.49%+8.69%-12.10%2.02%1.05%3.6313.474.42%Software - Application
EGHT8x8
1.8200.070+4.00%1.26M2.26M1.7401.7501.8301.720239.68M208.31M131.69M114.46M+15.19%+10.30%-13.74%-38.72%-16.13%-21.55%-31.84%--1.10%LossLoss6.29%Software - Application
SOPASociety Pass
0.92490.0347+3.90%76.22K70.12K0.89200.89020.94100.89014.59M4.07M4.97M4.40M+17.24%+31.40%-8.43%-5.91%-5.62%-58.84%+3.00%--1.73%LossLoss5.72%Software - Application
APPApplovin
276.8308.950+3.34%5.77M1.58B272.300267.880278.880266.50594.11B61.97B339.96M223.84M+16.21%+4.93%+5.78%-24.43%+61.28%+299.99%-14.51%--2.58%61.1161.114.62%Software - Application