PETWag! Group
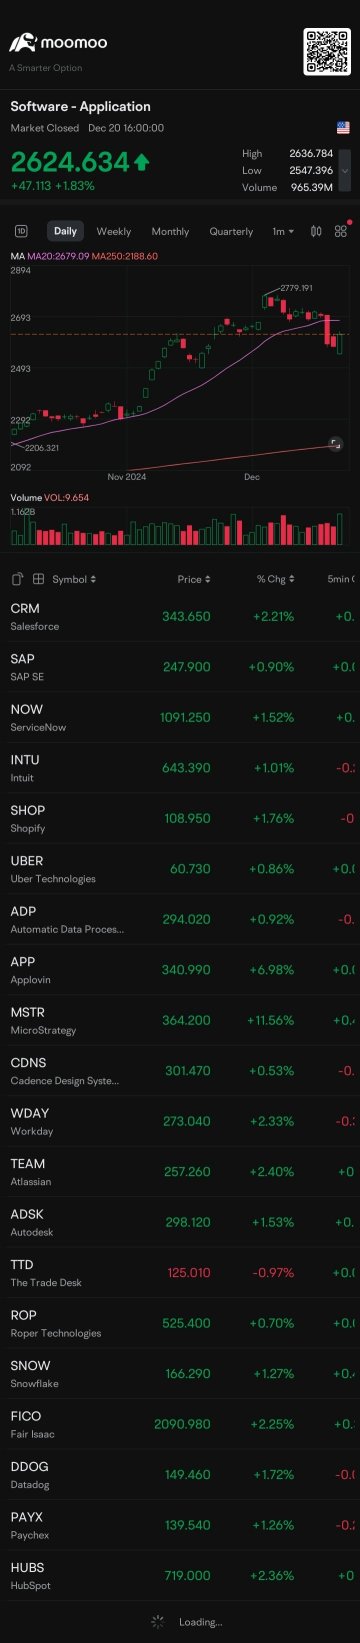
0.16470.0347+26.69%6.62M918.89K0.12700.13000.16900.12008.36M3.63M50.73M22.06M+76.72%+28.87%-4.02%-36.11%-77.13%-92.74%-30.89%--30.00%LossLoss37.69%Software - Application
BNZIBanzai International
1.0800.080+8.00%2.29M2.48M1.0101.0001.1301.00016.37M5.68M15.16M5.26M+8.54%+4.85%-8.47%-51.79%-55.74%-93.95%-29.41%--43.59%LossLoss13.00%Software - Application
EPWKEPWK Holdings
13.7101.000+7.87%104.06K1.38M13.00012.71013.94012.040306.01M77.63M22.32M5.66M+166.73%+174.75%+180.37%+234.39%+234.39%+234.39%+234.39%--1.84%LossLoss14.95%Software - Application
STECSantech Holdings
1.01000.0720+7.68%20.82K21.69K0.90000.93801.10000.900028.28M4.37M28.00M4.33M-4.72%-16.53%-20.47%+48.53%-41.95%+19.17%-17.89%--0.48%Loss1.6421.32%Software - Application
DUOTDuos Technologies
7.1200.430+6.43%232.18K1.62M6.6906.6907.3306.35082.98M59.24M11.65M8.32M+26.69%+51.81%+34.09%+21.09%+49.58%+123.90%+19.06%--2.79%LossLoss14.65%Software - Application
ATHRAether Holdings
6.2000.350+5.98%66.43K404.63K5.8805.8506.4325.84973.35M11.16M11.83M1.80M+23.02%+12.73%+44.19%+44.19%+44.19%+44.19%+44.19%--3.69%LossLoss9.96%Software - Application
APPFAppfolio
201.4909.470+4.93%940.84K186.18M192.010192.020202.060192.0107.26B4.41B36.03M21.91M-4.01%-10.13%-8.95%-20.54%-3.07%-17.00%-18.33%--4.30%37.5936.305.23%Software - Application
PERFPerfect
1.9800.090+4.76%176.69K353.30K1.9001.8902.0851.900201.66M56.61M101.85M28.59M+22.98%+19.28%+17.16%-12.78%+8.20%-16.10%-30.04%--0.62%29.5539.609.79%Software - Application
FTFTFuture FinTech
1.6000.070+4.58%67.24K105.16K1.5301.5301.6401.4804.88M4.40M3.05M2.75M+19.40%+21.21%-5.88%-39.16%-48.49%-82.00%-48.37%--2.44%LossLoss10.46%Software - Application
SYTSYLA Technologies
2.3420.101+4.49%5.25K11.97K2.2252.2422.3502.17662.14M13.35M26.53M5.70M+4.11%+6.96%+14.82%+38.19%+53.10%+20.74%+17.12%0.94%0.09%234.2415.027.75%Software - Application
QXOQXO Inc
13.4200.540+4.19%4.58M60.94M12.99012.88013.67012.9106.00B4.49B447.17M334.71M+5.50%-3.52%-2.47%0.00%-11.83%-85.56%-15.60%--1.37%LossLoss5.90%Software - Application
LPSNLivePerson
0.88280.0348+4.10%742.27K644.27K0.83000.84800.89910.830080.61M68.03M91.31M77.06M+24.08%+18.82%+9.68%-39.12%-25.19%+67.83%-41.92%--0.96%LossLoss8.15%Software - Application
QHQuhuo
1.4400.055+3.96%296.00415.871.3701.3851.4401.370129.15M126.17M89.70M87.62M-0.70%+14.28%+1.41%+4.34%-3.36%+161.80%-1.38%--0.00%Loss17.565.05%Software - Application
SAGTSagtec Global
3.8400.140+3.78%187.67K705.84K3.6003.7004.1203.36048.19M6.72M12.55M1.75M+58.37%+74.55%+47.13%-4.00%-4.00%-4.00%-4.00%--10.72%29.0947.4120.54%Software - Application
VTSIVirTra
4.1800.150+3.72%82.79K340.56K4.0304.0304.2503.94047.07M45.47M11.26M10.88M+13.28%-2.11%-2.11%-35.49%-31.48%-68.33%-38.07%--0.76%34.8334.837.69%Software - Application
SMRTSmartRent
0.92100.0329+3.70%1.61M1.45M0.88000.88810.93490.8772177.48M150.39M192.70M163.30M+15.69%+22.13%-17.77%-38.60%-45.50%-60.97%-47.37%--0.99%LossLoss6.50%Software - Application
INLXIntellinetics
14.9800.520+3.60%2.58K37.53K14.60014.46014.98014.45064.63M39.81M4.31M2.66M+11.25%+7.15%+23.60%+9.34%+7.46%+104.09%+8.95%--0.10%LossLoss3.67%Software - Application
NATLNCR Atleos
27.5500.940+3.53%418.71K11.42M26.59026.61027.59426.5292.01B1.98B73.04M71.82M+15.47%+12.40%+3.61%-16.06%+5.23%+30.82%-18.78%--0.58%22.4022.404.00%Software - Application
MAPSWM Technology
1.1800.040+3.51%731.76K852.87K1.1601.1401.1901.145123.93M109.77M105.03M93.02M+13.46%+14.01%-2.48%-15.11%+52.24%+11.32%-14.49%--0.79%14.7514.753.95%Software - Application
YALAYalla
8.0300.270+3.48%2.39M19.05M7.9907.7608.1507.8401.27B429.79M157.54M53.52M+24.69%+36.80%+48.43%+97.78%+93.96%+70.13%+97.78%--4.47%10.8510.854.00%Software - Application
YAASYouxin Technology
2.4500.080+3.38%22.26K51.87K2.2502.3702.4802.21082.20M10.23M33.55M4.18M+31.02%+34.62%+2.08%-35.70%-45.56%-45.56%-39.15%--0.53%LossLoss11.39%Software - Application
LDTCLeddarTech
0.43900.0139+3.27%90.15K38.96K0.41510.42510.45000.415116.50M12.12M37.59M27.62M+18.33%+12.10%-11.49%-51.00%+75.60%-80.58%-70.73%--0.33%LossLoss8.21%Software - Application
MRTMarti Technologies
3.1600.100+3.27%79.75K245.91K3.0003.0603.2102.898185.18M21.05M58.60M6.66M+9.72%+8.59%0.00%+0.96%+58.79%+110.67%-6.78%--1.20%LossLoss10.20%Software - Application
ELWSEarlyworks
1.9700.060+3.14%45.62K88.94K1.9001.9102.1001.8305.94M2.11M3.02M1.07M-0.51%+4.79%-14.35%-40.28%-15.53%-40.39%-25.94%--4.26%LossLoss14.14%Software - Application
AIFFFirefly Neuroscience
3.3000.100+3.13%159.87K515.64K3.2003.2003.3443.16038.36M24.38M11.62M7.39M+11.49%+3.77%-19.71%-7.04%+6.80%-52.12%+24.53%--2.16%LossLoss5.75%Software - Application
APPApplovin
284.9808.150+2.94%6.31M1.77B278.640276.830286.828273.50096.88B63.79B339.96M223.84M+24.92%+14.01%+4.63%-22.03%+68.24%+286.05%-12.00%--2.82%62.9162.914.82%Software - Application
CNTMConnectM Technology Solutions
0.65340.0184+2.90%598.31K394.17K0.62200.63500.68390.622023.20M17.40M35.51M26.63M+2.48%-7.97%+16.64%-45.09%-23.13%-94.19%-46.00%--2.25%LossLoss9.75%Software - Application
SAPSAP SE
285.3507.400+2.66%1.48M419.91M284.720277.950286.570282.747333.03B293.24B1.17B1.03B+13.89%+10.11%+6.47%+2.14%+22.13%+55.19%+15.90%0.83%0.14%94.8094.801.38%Software - Application
SGNSigning Day Sports
0.57390.0138+2.46%145.75K82.77K0.57600.56010.59540.54041.14M928.01K1.99M1.62M+14.78%-28.71%-22.90%-77.58%-93.90%-95.94%-78.18%--9.01%LossLoss9.82%Software - Application
RMSGReal Messenger
2.1530.051+2.41%59.97K130.96K2.0702.1032.5202.06020.07M17.92M9.32M8.32M+4.02%+5.56%-4.02%+9.30%-83.04%-81.51%-15.56%--0.72%LossLoss21.90%Software - Application