


GDCGD Culture Group
2.3600.370+18.59%77.24K168.06K1.9901.9902.4001.99028.99M28.78M12.28M12.19M-5.22%-5.22%-9.23%+67.38%+52.26%+221.09%+24.87%--0.63%LossLoss20.60%Electronic Gaming & Multimedia
TRUGTruGolf
0.30950.0269+9.52%1.09M314.52K0.29360.28260.31000.27159.25M5.45M29.88M17.59M+21.37%-12.82%-20.54%-40.71%-55.72%-81.58%-53.90%--6.17%LossLoss13.62%Electronic Gaming & Multimedia
SOHUSohu.com
9.9000.270+2.80%170.23K1.69M9.5609.63010.0409.560297.65M183.34M30.07M18.52M+18.85%+8.91%-27.15%-22.90%-30.91%-11.61%-24.89%--0.92%LossLoss4.98%Electronic Gaming & Multimedia
MYPSplaystudios
1.2700.030+2.42%154.19K194.46K1.2201.2401.2801.220159.38M111.70M125.49M87.95M-0.78%+1.60%-8.30%-31.72%-9.29%-42.53%-31.72%--0.18%LossLoss4.84%Electronic Gaming & Multimedia
SNALSnail
1.1000.020+1.85%70.16K76.46K1.0801.0801.1501.03040.94M8.82M37.21M8.02M+8.91%+37.50%-9.09%-43.88%-24.66%+0.79%-40.86%--0.88%22.0022.0011.11%Electronic Gaming & Multimedia
GCLGCL Global
2.2400.040+1.82%79.84K179.30K2.1002.2002.3982.100282.86M84.43M126.28M37.69M+14.87%+11.72%+12.00%-67.82%-80.07%-79.18%-80.47%--0.21%LossLoss13.55%Electronic Gaming & Multimedia
GRVYGravity
59.6701.040+1.77%5.54K329.00K60.38058.63060.38058.477414.64M168.70M6.95M2.83M+2.00%+0.40%-2.83%-2.04%-7.34%-10.53%-5.45%--0.20%6.996.993.25%Electronic Gaming & Multimedia
GXAIGaxos.ai
1.1600.020+1.75%85.37K97.63K1.1601.1401.1651.1108.26M7.58M7.12M6.54M+5.45%+7.41%-4.13%-30.95%-17.73%-76.85%-54.86%--1.31%LossLoss4.79%Electronic Gaming & Multimedia
RBLXRoblox
66.5800.890+1.35%4.44M294.07M65.55565.69066.90065.42044.43B38.82B667.30M583.10M+11.51%+18.64%+11.90%-4.99%+54.33%+87.39%+15.07%--0.76%LossLoss2.25%Electronic Gaming & Multimedia
GIGMGigaMedia
1.6000.020+1.27%27.42K43.61K1.5801.5801.6091.58017.68M9.93M11.05M6.20M+2.57%+2.57%-8.57%+5.27%+13.89%+18.53%+3.57%--0.44%LossLoss1.82%Electronic Gaming & Multimedia
TTWOTake-Two Interactive Software
225.3802.690+1.21%1.53M344.21M222.650222.690225.490222.28039.78B36.82B176.50M163.36M+5.93%+10.26%+5.18%+18.56%+38.36%+57.14%+22.44%--0.94%LossLoss1.44%Electronic Gaming & Multimedia
PLTKPlaytika Holding
5.2500.030+0.57%836.80K4.37M5.2205.2205.2505.1751.97B292.53M375.32M55.72M+6.49%+6.06%+0.96%-27.82%-31.30%-20.79%-22.62%7.62%1.50%11.9311.931.44%Electronic Gaming & Multimedia
GMGIGolden Matrix Group
2.0800.010+0.48%53.34K109.95K2.0602.0702.1002.030274.74M29.63M132.09M14.24M+0.97%+10.05%-0.95%+7.22%-10.73%-49.39%+5.05%--0.37%LossLoss3.38%Electronic Gaming & Multimedia
EAElectronic Arts Inc
146.6000.410+0.28%1.84M269.02M146.570146.190147.250145.42038.21B34.47B260.62M235.12M+0.68%+5.17%+0.89%+25.37%-1.45%+15.77%+0.35%0.52%0.78%37.3031.321.25%Electronic Gaming & Multimedia
GMHSGamehaus Holdings
1.2200.0000.00%22.73K28.00K1.2151.2201.3101.19065.35M35.30M53.57M28.94M+2.52%+1.67%-33.33%-36.46%-89.21%-88.60%-89.17%--0.08%10.1710.179.82%Electronic Gaming & Multimedia
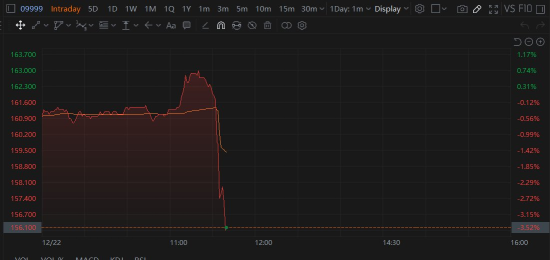
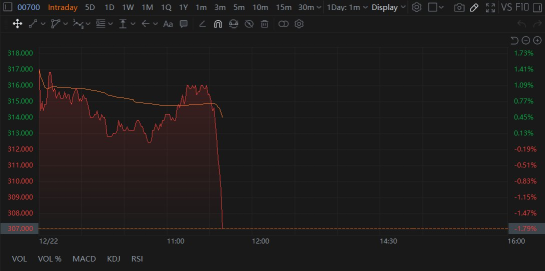
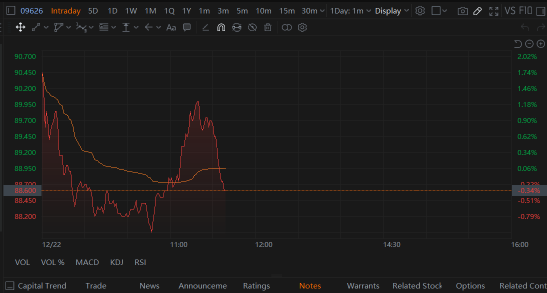
NTESNetEase
105.860-0.050-0.05%712.86K75.43M105.670105.910106.800105.22067.03B37.14B633.20M350.83M+7.22%+12.26%+4.04%+6.18%+33.42%+15.64%+20.08%2.26%0.20%16.7916.791.49%Electronic Gaming & Multimedia
DDIDoubleDown Interactive
9.800-0.010-0.10%20.79K202.01K9.5509.81010.0009.500485.62M66.91M49.55M6.83M-0.51%-0.71%-1.61%-3.35%-30.74%-12.19%-6.13%--0.31%3.913.915.10%Electronic Gaming & Multimedia
MSGMMotorsport Games
2.400-0.010-0.41%124.92K300.60K2.4102.4102.4902.3107.64M3.94M3.18M1.64M-12.73%+190.91%+120.18%+72.66%+87.50%-4.76%+79.10%--7.61%LossLoss7.47%Electronic Gaming & Multimedia
SKLZSkillz
4.780-0.020-0.42%36.98K178.91K4.7404.8004.9004.69579.83M53.90M16.70M11.28M+7.42%+18.91%+1.70%-28.23%-16.43%-23.27%-4.97%--0.33%LossLoss4.27%Electronic Gaming & Multimedia
BHATBlue Hat Interactive Entertainment Technology
2.160-0.020-0.92%84.25K183.65K2.1202.1802.2802.11010.67M10.36M4.94M4.80M-8.86%+12.50%+15.51%-44.76%-92.50%-98.14%-84.29%--1.76%LossLoss7.80%Electronic Gaming & Multimedia
GAMEGameSquare
0.7488-0.0112-1.47%810.32K643.82K0.78000.76000.84470.692729.14M22.11M38.91M29.53M+1.61%+20.39%+5.07%-14.22%-7.78%-52.61%-9.25%--2.74%LossLoss20.00%Electronic Gaming & Multimedia
TBHBrag House
0.6040-0.0191-3.07%446.44K261.66K0.64600.62310.66730.53666.48M890.90K10.72M1.48M-9.58%-2.58%-89.85%-84.90%-84.90%-84.90%-84.90%--30.27%LossLoss20.98%Electronic Gaming & Multimedia
GDEVGDEV Inc
10.384-0.476-4.38%18.75K208.81K11.04010.86011.69010.384188.27M57.45M18.13M5.53M-12.96%+3.95%-14.18%-21.53%-64.65%-44.72%-35.12%--0.34%7.527.5212.02%Electronic Gaming & Multimedia

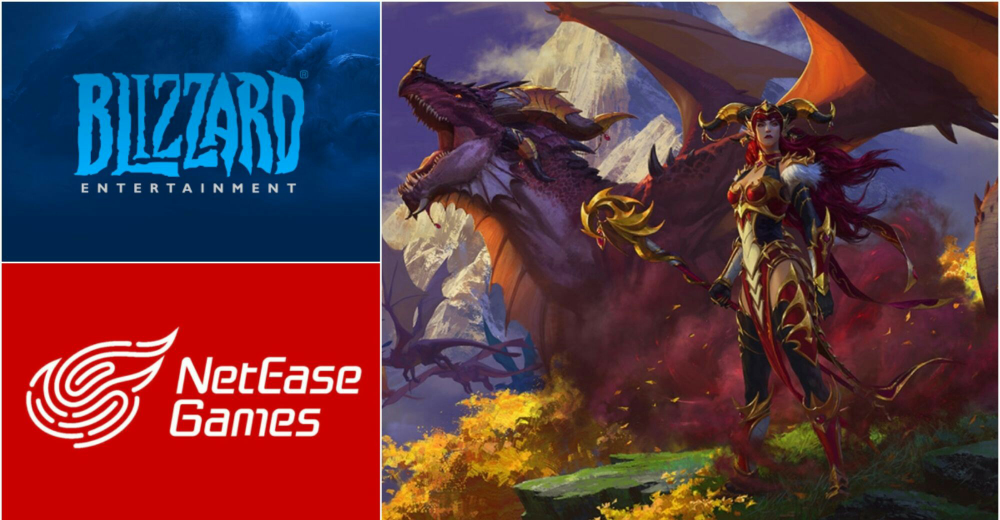


good game go : now is time to greedy