


CSIQCanadian Solar
11.1501.870+20.15%11.78M127.35M8.8659.28011.3858.800737.72M503.80M66.16M45.18M+49.46%+54.65%+16.27%+8.89%-21.15%-23.10%+0.27%--26.08%20.6520.6527.86%Solar
ARRYArray Technologies
5.0200.460+10.09%5.51M27.11M4.5104.5605.0604.450765.61M690.91M152.51M137.63M+15.94%+20.96%-1.76%-29.79%-19.29%-57.96%-16.89%--4.00%LossLoss13.38%Solar
SEDGSolarEdge Technologies
12.5600.845+7.21%4.23M51.38M11.81511.71512.58011.450741.58M732.13M59.04M58.29M-0.63%+8.46%-21.16%-3.09%-25.64%-77.81%-7.65%--7.25%LossLoss9.65%Solar
SHLSShoals Technologies
3.6400.240+7.06%6.76M24.23M3.3703.4003.6603.335607.86M604.48M166.99M166.06M+7.69%+8.33%+6.43%-20.87%-30.93%-55.93%-34.18%--4.07%26.0026.009.56%Solar
BEEMBeam Global
1.5300.100+6.99%99.64K151.25K1.4301.4301.5801.43023.71M22.92M15.49M14.98M+5.52%-9.47%-28.84%-43.96%-70.00%-76.21%-51.74%--0.67%LossLoss10.48%Solar
SOLEmeren Group
1.3900.080+6.11%104.18K141.44K1.3101.3101.3901.30071.34M44.50M51.32M32.02M+10.32%+2.21%-14.20%-24.04%-43.72%-23.20%-31.53%--0.33%LossLoss6.87%Solar
ASTIAscent Solar Technologies
1.6800.079+4.96%33.65K55.02K1.5901.6011.6901.5902.87M2.86M1.71M1.70M+19.15%+25.37%-6.15%-23.98%-50.00%-82.68%-48.62%--1.98%LossLoss6.25%Solar
TYGOTigo Energy
0.85000.0400+4.94%29.89K25.01K0.83000.81000.85000.800052.63M22.22M61.91M26.15M+6.82%+19.38%-10.53%-11.09%-24.78%-10.53%-13.70%--0.11%LossLoss6.17%Solar
JKSJinkoSolar
17.6600.820+4.87%1.25M22.14M16.99016.84018.18016.670938.71M587.26M53.15M33.25M+9.01%+27.23%-12.14%-12.70%-30.34%-17.34%-29.08%8.26%3.77%LossLoss8.97%Solar
RUNSunrun
7.3900.340+4.82%10.32M76.12M7.0107.0507.6306.9001.67B1.33B226.21M180.42M+7.88%+22.55%+22.96%-21.30%-47.55%-23.89%-20.11%--5.72%LossLoss10.36%Solar
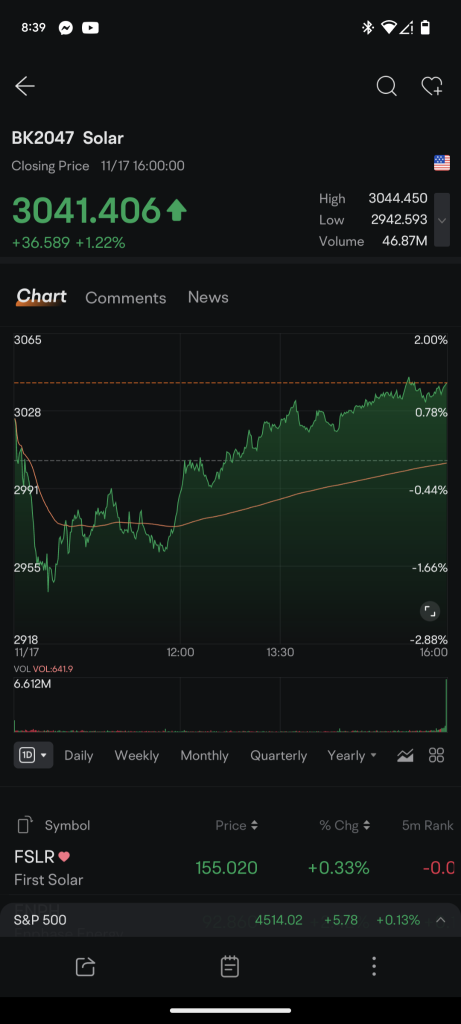
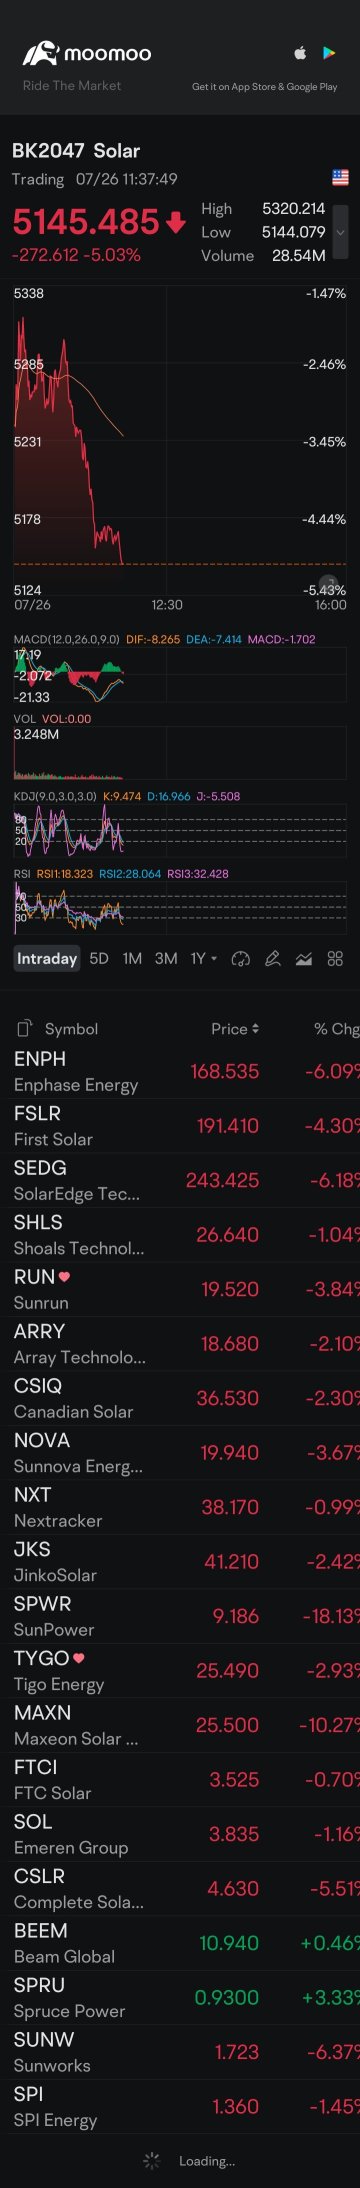
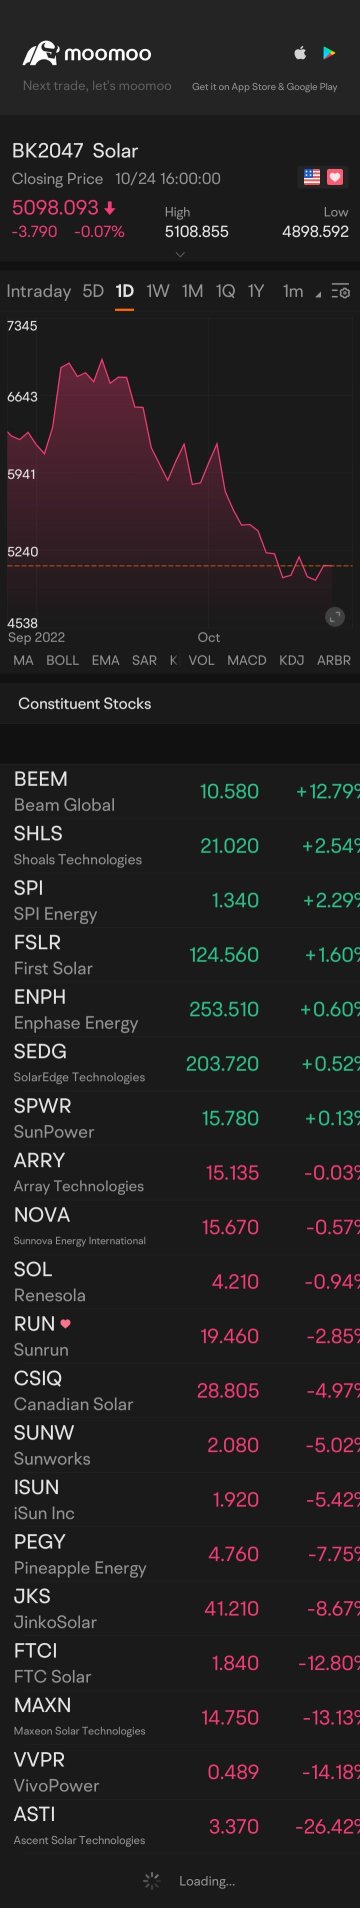
FSLRFirst Solar
141.8605.420+3.97%2.70M378.47M135.010136.440142.200134.92015.19B14.13B107.06M99.58M+10.85%+16.10%+12.05%-14.55%-28.17%-18.95%-19.51%--2.71%11.8011.805.34%Solar
NXTNextracker
43.6501.300+3.07%1.07M46.12M42.36042.35043.72042.0306.27B6.24B143.71M143.00M+8.31%+15.63%+2.11%-11.35%+36.53%+1.56%+19.49%--0.75%10.9112.953.99%Solar
ENPHEnphase Energy
46.8301.080+2.36%4.64M215.58M45.51045.75047.33044.8306.14B5.95B131.21M126.95M-10.87%-5.51%-22.86%-23.07%-43.22%-56.57%-31.81%--3.66%42.9662.445.46%Solar
NOVASunnova Energy International
0.21480.0045+2.14%6.99M1.47M0.20000.21030.22100.194326.87M22.23M125.08M103.48M+22.39%-22.98%-36.20%-92.10%-96.01%-94.16%-93.74%--6.75%LossLoss12.70%Solar
MAXNMaxeon Solar Technologies
3.5500.070+2.01%113.45K400.44K3.4103.4803.6363.35259.32M23.66M16.71M6.67M+24.13%+8.23%+10.94%-41.32%-58.91%-98.01%-52.92%--1.70%LossLoss8.18%Solar
FTCIFTC Solar
3.1800.050+1.60%118.27K371.09K3.0603.1303.3002.94040.92M15.83M12.87M4.98M+17.78%+22.31%+25.20%-21.87%-40.61%-20.84%-42.29%--2.38%LossLoss11.50%Solar
VSTEVast Renewables
0.38160.0056+1.49%274.57K106.29K0.36470.37600.39640.364711.44M4.75M29.97M12.44M+5.41%+10.19%+15.53%-61.18%-83.19%-90.46%-65.62%--2.21%LossLoss8.43%Solar
TURBTurbo Energy
2.4820.032+1.30%2.55K6.16K2.3652.4502.4822.36027.34M2.48M11.02M1.00M+0.14%-3.80%+8.85%+3.41%+58.81%+106.82%+14.90%--0.26%LossLoss4.97%Solar
TOYOTOYO Co
2.7900.019+0.67%1.75K4.95K2.9482.7712.9482.790130.00M59.00M46.60M21.15M+1.45%+1.45%-8.37%-14.68%+11.16%-75.20%-17.46%--0.01%16.4116.415.69%Solar
SPWRSunPower
1.9800.0000.00%355.95K704.24K1.9901.9802.0301.930146.06M114.24M73.77M57.70M+1.54%+35.15%+22.98%+9.39%-9.59%+372.10%+10.61%--0.62%LossLoss5.05%Solar
SPRUSpruce Power
1.940-0.010-0.51%51.37K100.77K1.9401.9502.0101.92035.07M34.20M18.08M17.63M-6.28%-8.49%-20.49%-26.24%-23.92%-55.61%-34.68%--0.29%LossLoss4.62%Solar
PNSkycorp Solar Group
2.520-0.030-1.18%20.05K52.27K2.7002.5502.7002.50068.04M5.04M27.00M2.00M-1.18%-17.38%-17.38%+4.45%+4.45%+4.45%+4.45%--1.00%148.24148.247.84%Solar
VVPRVivoPower
2.960-0.070-2.31%195.77K578.20K3.1003.0303.1102.84022.61M17.36M7.64M5.87M+16.54%-11.11%-29.19%+166.67%+258.79%-20.43%+122.56%--3.34%LossLoss8.91%Solar
SMXTSolarMax Technology
1.110-0.050-4.31%79.67K88.39K1.1501.1601.1501.09050.87M27.06M45.83M24.38M-2.63%+2.78%-4.31%-33.53%+15.77%-86.69%-31.48%--0.33%LossLoss5.17%Solar
ZEOZeo Energy
1.700-0.080-4.49%97.64K164.16K1.7901.7801.8631.61038.73M19.02M22.78M11.19M-2.86%+34.92%+4.56%-24.11%+24.09%-65.31%-50.44%--0.87%LossLoss14.21%Solar
SUNESUNation Energy
2.685-0.295-9.90%557.70K1.53M2.8402.9802.8652.6709.03M9.03M3.36M3.36M-32.88%-36.67%-96.98%-99.26%-99.67%-99.97%-99.49%--16.58%0.000.006.54%Solar


BLACK K3ymatch : Can famous in sector