


01330DYNAGREEN ENV
4.2900.300+7.52%18.89M82.03M4.0203.9904.5004.0205.98B1.73B1.39B404.36M+9.44%+10.85%+32.00%+28.06%+35.76%+79.87%+19.50%6.41%4.67%8.749.4712.03%Environmental Services
03311CHINA STATE CON
11.3600.680+6.37%9.89M110.63M10.68010.68011.60010.68060.01B60.01B5.28B5.28B+5.77%+4.99%+10.29%-0.35%-1.05%+40.33%-7.34%5.17%0.19%6.416.418.61%Heavy Infrastructure
01052YUEXIUTRANSPORT
3.4800.060+1.75%1.82M6.28M3.4303.4203.4803.4105.82B5.82B1.67B1.67B+1.75%+2.65%-3.33%-4.66%-5.69%-2.52%-9.61%7.76%0.11%8.218.212.05%Railroads & Highways
02388BOC HONG KONG
31.0000.500+1.64%15.60M484.19M30.50030.50031.30030.500327.76B327.76B10.57B10.57B+5.98%+7.27%+3.85%+23.75%+21.33%+46.68%+24.25%5.53%0.15%8.578.572.62%Banks
08191HONG WEI ASIA
0.2060.003+1.48%141.00K27.93K0.1940.2030.2070.19010.85M10.85M52.66M52.66M+11.35%+13.19%-11.21%-11.59%-2.83%-9.65%-2.83%--0.27%LossLoss8.37%Forestry & Timber
00560CHU KONG SHIP
0.7700.010+1.32%150.00K113.96K0.7500.7600.7700.750863.30M863.30M1.12B1.12B+4.05%+1.32%-6.10%0.00%-1.28%+6.94%+1.32%9.09%0.01%7.407.402.63%Shipping & Ports
00144CHINA MER PORT
12.4200.140+1.14%2.48M30.83M12.36012.28012.58012.32052.14B52.14B4.20B4.20B+1.47%+2.99%-7.17%-4.90%-7.59%+33.12%-10.26%5.88%0.06%6.596.592.12%Shipping & Ports
03968CM BANK
44.7000.450+1.02%10.67M477.27M44.60044.25045.10044.1501.13T205.21B25.22B4.59B+3.11%+6.81%-2.19%+4.56%+13.60%+46.62%+11.75%4.84%0.23%7.037.032.15%Banks
01233TIMES CHINA
0.2310.002+0.87%195.00K44.05K0.2220.2290.2340.222485.52M485.52M2.10B2.10B-1.70%-2.53%-16.00%-37.57%-45.65%+65.00%-48.09%--0.01%LossLoss5.24%Real Estate Developers
00737BAY AREA DEV
1.8200.010+0.55%258.30K473.21K1.8101.8101.8401.8005.61B5.61B3.08B3.08B+3.41%+4.60%+2.25%-4.21%-5.21%+21.53%0.00%11.70%0.01%11.1011.232.21%Railroads & Highways
00152SHENZHEN INT'L
7.9200.020+0.25%2.08M16.51M7.9507.9008.0007.80019.08B19.08B2.41B2.41B+0.51%+5.04%+2.72%+8.64%+18.39%+44.00%+9.24%5.01%0.09%6.646.642.53%Railroads & Highways
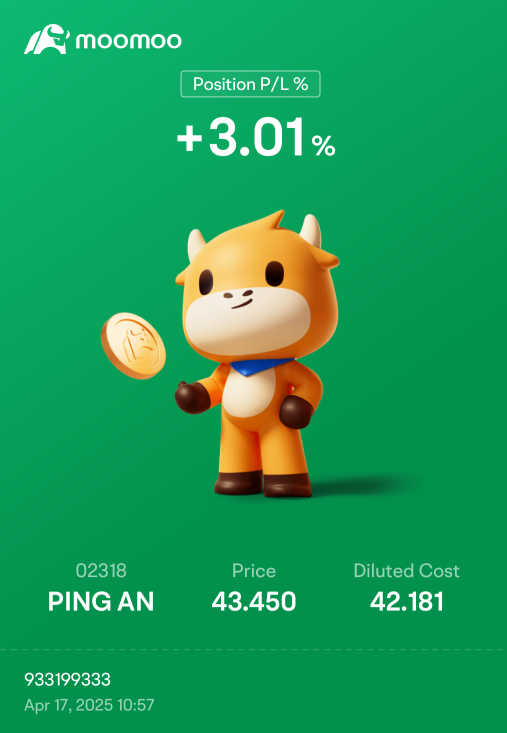
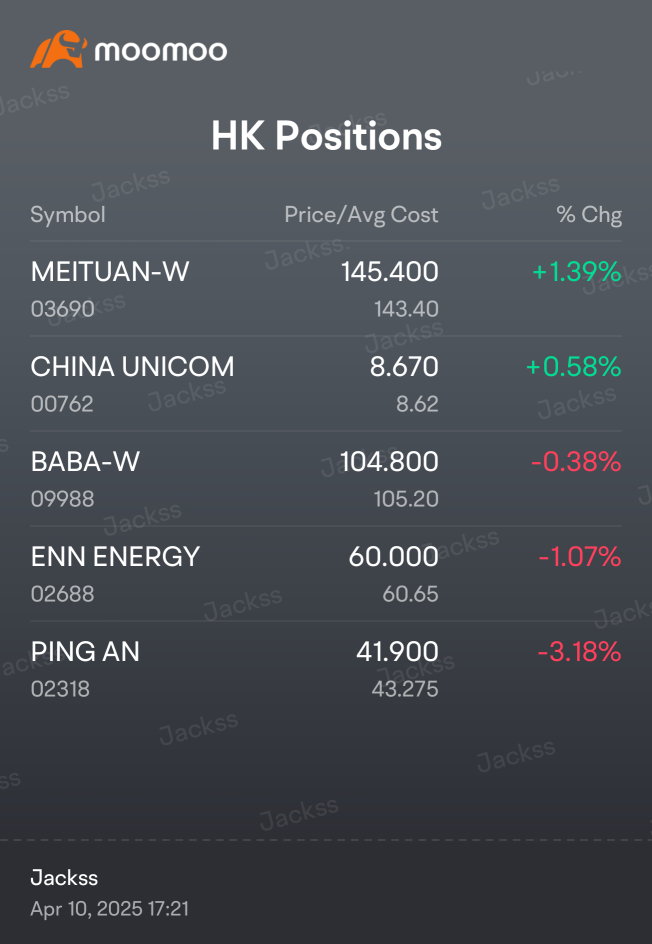
02318PING AN
46.0000.050+0.11%43.90M2.00B45.20045.95046.10044.600837.67B342.59B18.21B7.45B+5.02%+9.79%-2.44%+5.75%-6.12%+60.10%-0.11%5.80%0.59%6.616.133.26%Insurance
01638KAISA GROUP
0.1800.0000.00%1.54M276.36K0.1850.1800.1850.1751.26B1.26B7.02B7.02B+7.14%+14.65%-8.16%0.00%-38.98%+122.22%-9.09%--0.02%LossLoss5.56%Real Estate Developers
03333EVERGRANDE
0.1630.0000.00%0.000.000.0000.1630.0000.0002.15B2.15B13.20B13.20B-12.37%-19.70%-30.64%-19.70%-89.94%-97.19%-30.64%--0.00%LossLoss0.00%Real Estate Developers
01313CR BLDG MAT TEC
1.6900.0000.00%5.05M8.52M1.7101.6901.7201.66011.80B11.80B6.98B6.98B0.00%-1.17%-6.63%+14.97%-13.33%+60.34%+6.29%1.54%0.07%31.3051.213.55%Construction Materials
03399YUEYUN TRANS
1.420-0.010-0.70%135.00K192.84K1.4301.4301.4401.4201.14B293.94M799.85M207.00M-2.07%+3.65%-8.97%+5.97%-4.70%+49.16%+9.23%6.20%0.07%4.454.451.40%Travel & Sightseeing
00604SHENZHEN INVEST
0.780-0.010-1.27%728.00K567.09K0.7900.7900.7900.7706.94B6.94B8.90B8.90B+1.30%+6.85%-4.88%-1.27%-18.75%-9.30%-10.34%8.97%0.01%LossLoss2.53%Real Estate Developers
02039CIMC
4.870-0.070-1.42%1.62M7.93M4.9404.9404.9404.85026.26B15.05B5.39B3.09B+3.84%+3.62%-17.60%-5.07%-17.88%-30.29%-9.98%0.49%0.05%8.188.181.82%Commercial Vehicles
00914CONCH CEMENT
21.950-0.400-1.79%4.69M102.87M22.25022.35022.25021.750116.32B28.53B5.30B1.30B-0.45%-2.66%-3.52%+7.33%-0.90%+34.78%+10.41%4.80%0.36%13.3813.382.24%Construction Materials
03380LOGAN GROUP
0.850-0.030-3.41%10.56M8.95M0.8800.8800.8900.8304.83B4.83B5.69B5.69B-4.49%+1.19%-10.53%-11.46%-17.48%+63.46%-20.56%--0.19%LossLoss6.82%Real Estate Developers
02007COUNTRY GARDEN
0.425-0.015-3.41%42.10M18.00M0.4450.4400.4450.42011.90B11.90B27.99B27.99B-2.30%-1.16%-10.53%+1.19%-42.57%-74.24%-12.37%--0.15%LossLoss5.68%Real Estate Developers
03383AGILE GROUP
0.465-0.020-4.12%4.89M2.28M0.4850.4850.4850.4602.35B2.35B5.05B5.05B-2.11%+1.09%-15.45%-23.77%-50.53%+16.25%-37.16%--0.10%LossLoss5.16%Real Estate Developers
01813KWG GROUP
0.335-0.015-4.29%614.00K206.75K0.3400.3500.3500.3301.15B1.15B3.42B3.42B0.00%+9.84%-5.63%-2.90%-32.32%+41.35%-16.25%--0.02%LossLoss5.71%Real Estate Developers
02202CHINA VANKE
5.470-0.250-4.37%47.46M260.93M5.7305.7205.7605.41065.26B12.07B11.93B2.21B-7.29%-3.01%-4.20%-0.55%-24.66%+45.48%+3.40%--2.15%LossLoss6.12%Real Estate Developers
00895DONGJIANG ENV
1.800-0.090-4.76%5.78M10.46M1.8701.8901.8701.7801.99B360.25M1.11B200.14M+5.88%+8.43%-5.76%+9.09%-21.40%+2.27%-2.70%--2.89%LossLoss4.76%Environmental Services
03883CHINA AOYUAN
0.124-0.009-6.77%11.98M1.51M0.1320.1330.1320.124519.13M519.13M4.19B4.19B-1.59%0.00%-31.87%-40.10%-65.07%+22.77%-43.12%--0.29%13.7813.786.02%Real Estate Developers


Saywallahcuzzy : not necessarily.
"the group's insurance business remained healthy.
Group operating profit, a gauge used to measure operations excluding investment volatilities, rose 2.4% in January to March.
The number of retail customers rose 1% year to date to 245 million at the end March, the filing showed.
The new business value of the life and health insurance business, which measures the profitability of new policies sold, grew 34.9% to 12.89 billion yuan"
102278658 OP : insti will take this oppo to sell down, and collect below for excellent divy yield
Phoon1981 : Not for the weak to hold.
102278658 OP : funny why ping an didn't drop
WinningTrader Saywallahcuzzy : No reason to sell.
View more comments...